our archive

welcome to your archive. this is your all post. edit or delete them, then start writing!

Joshua Novick > Blog > Uncategorized

High return stocks and companies.

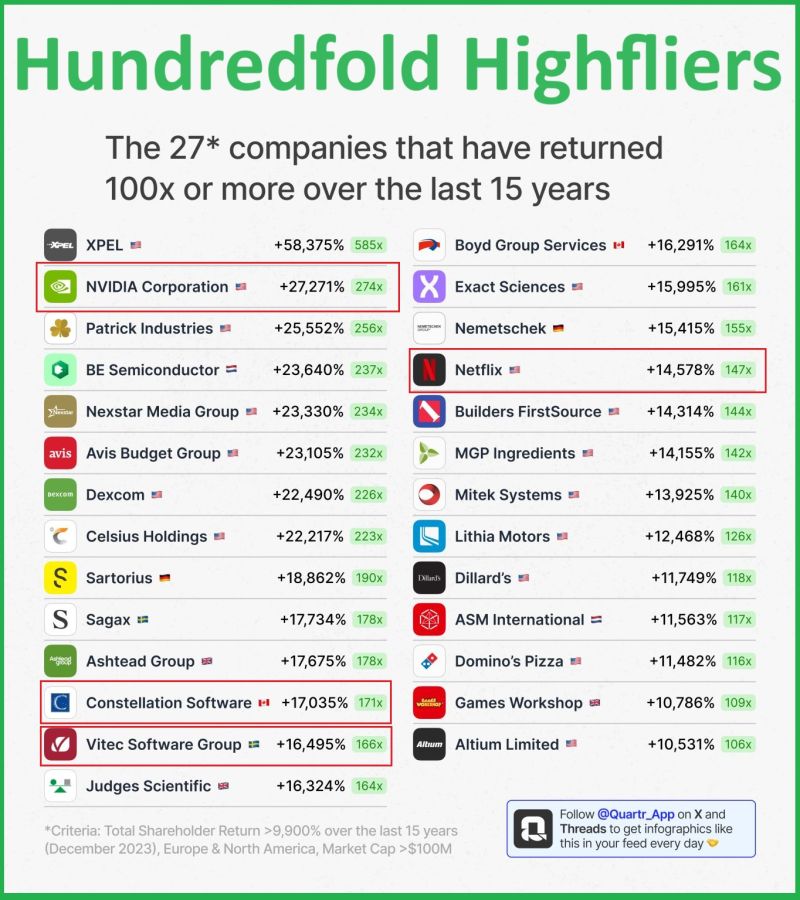
Beneath the surface of high-profile investment channels lies a trove of publicly traded companies that have quietly delivered astronomical returns. These market leaders, some once obscure entities, have not only surpassed the coveted 100X return but have also reshaped industries with their innovative products and strategic growth. We explore these high-flying entities that have transformed modest investments into fortunes, spotlighting their financial milestones, market strategies, and the investment wisdom they embody.

💰It’s not only through venture capital or crypto investment that you can make 100X returns. There are several companies where, if you had invested
💲10k 15 years ago, you would now have at least 💲1 million .

🤫Most of these companies were unknown to me. XPEL, the top performer on this list with a staggering 595X return in 15 years, is a company specializing in paint and window protection film for cars, homes, and offices.

🚗It’s a relatively small enterprise that generated $370M in revenue, $73M in EBITDA, and $49M in net profit over the last 12 months, boasting a market cap of $1.5 billion.

But, to my surprise, a few companies on the list are ones I have analyzed and written about recently.

🤖 NVIDIA, the sixth most valuable company globally (with a 1.2 trillion market cap), is renowned for its graphics processing units (GPUs), now pivotal in powering the artificial intelligence (AI) revolution 🌐. If you had bought $10k of NVIDIA stock 15 years ago (and held onto it), you would now have over $2.5 million. Back in 2008, NVIDIA was a $4B revenue company.

Let’s look at some current data (Trailing 12 months) for NVIDIA:

🔸$45 billion in revenue
🔸70% gross margin
🔸49% EBITDA margin
🔸$19B net profit (42% margin)

🌌Constellation Software Inc., another favorite of mine (I just posted about it 10 days ago), has returned 171X in the past 15 years! Constellation is a voracious acquirer, having acquired over 500 small software companies. Fifteen years ago, in 2008, it was generating $330 million in revenue.

Some numbers on Constellation, the software roll-up king:

🔸$52 billion market cap (#339 in the worldwide ranking)
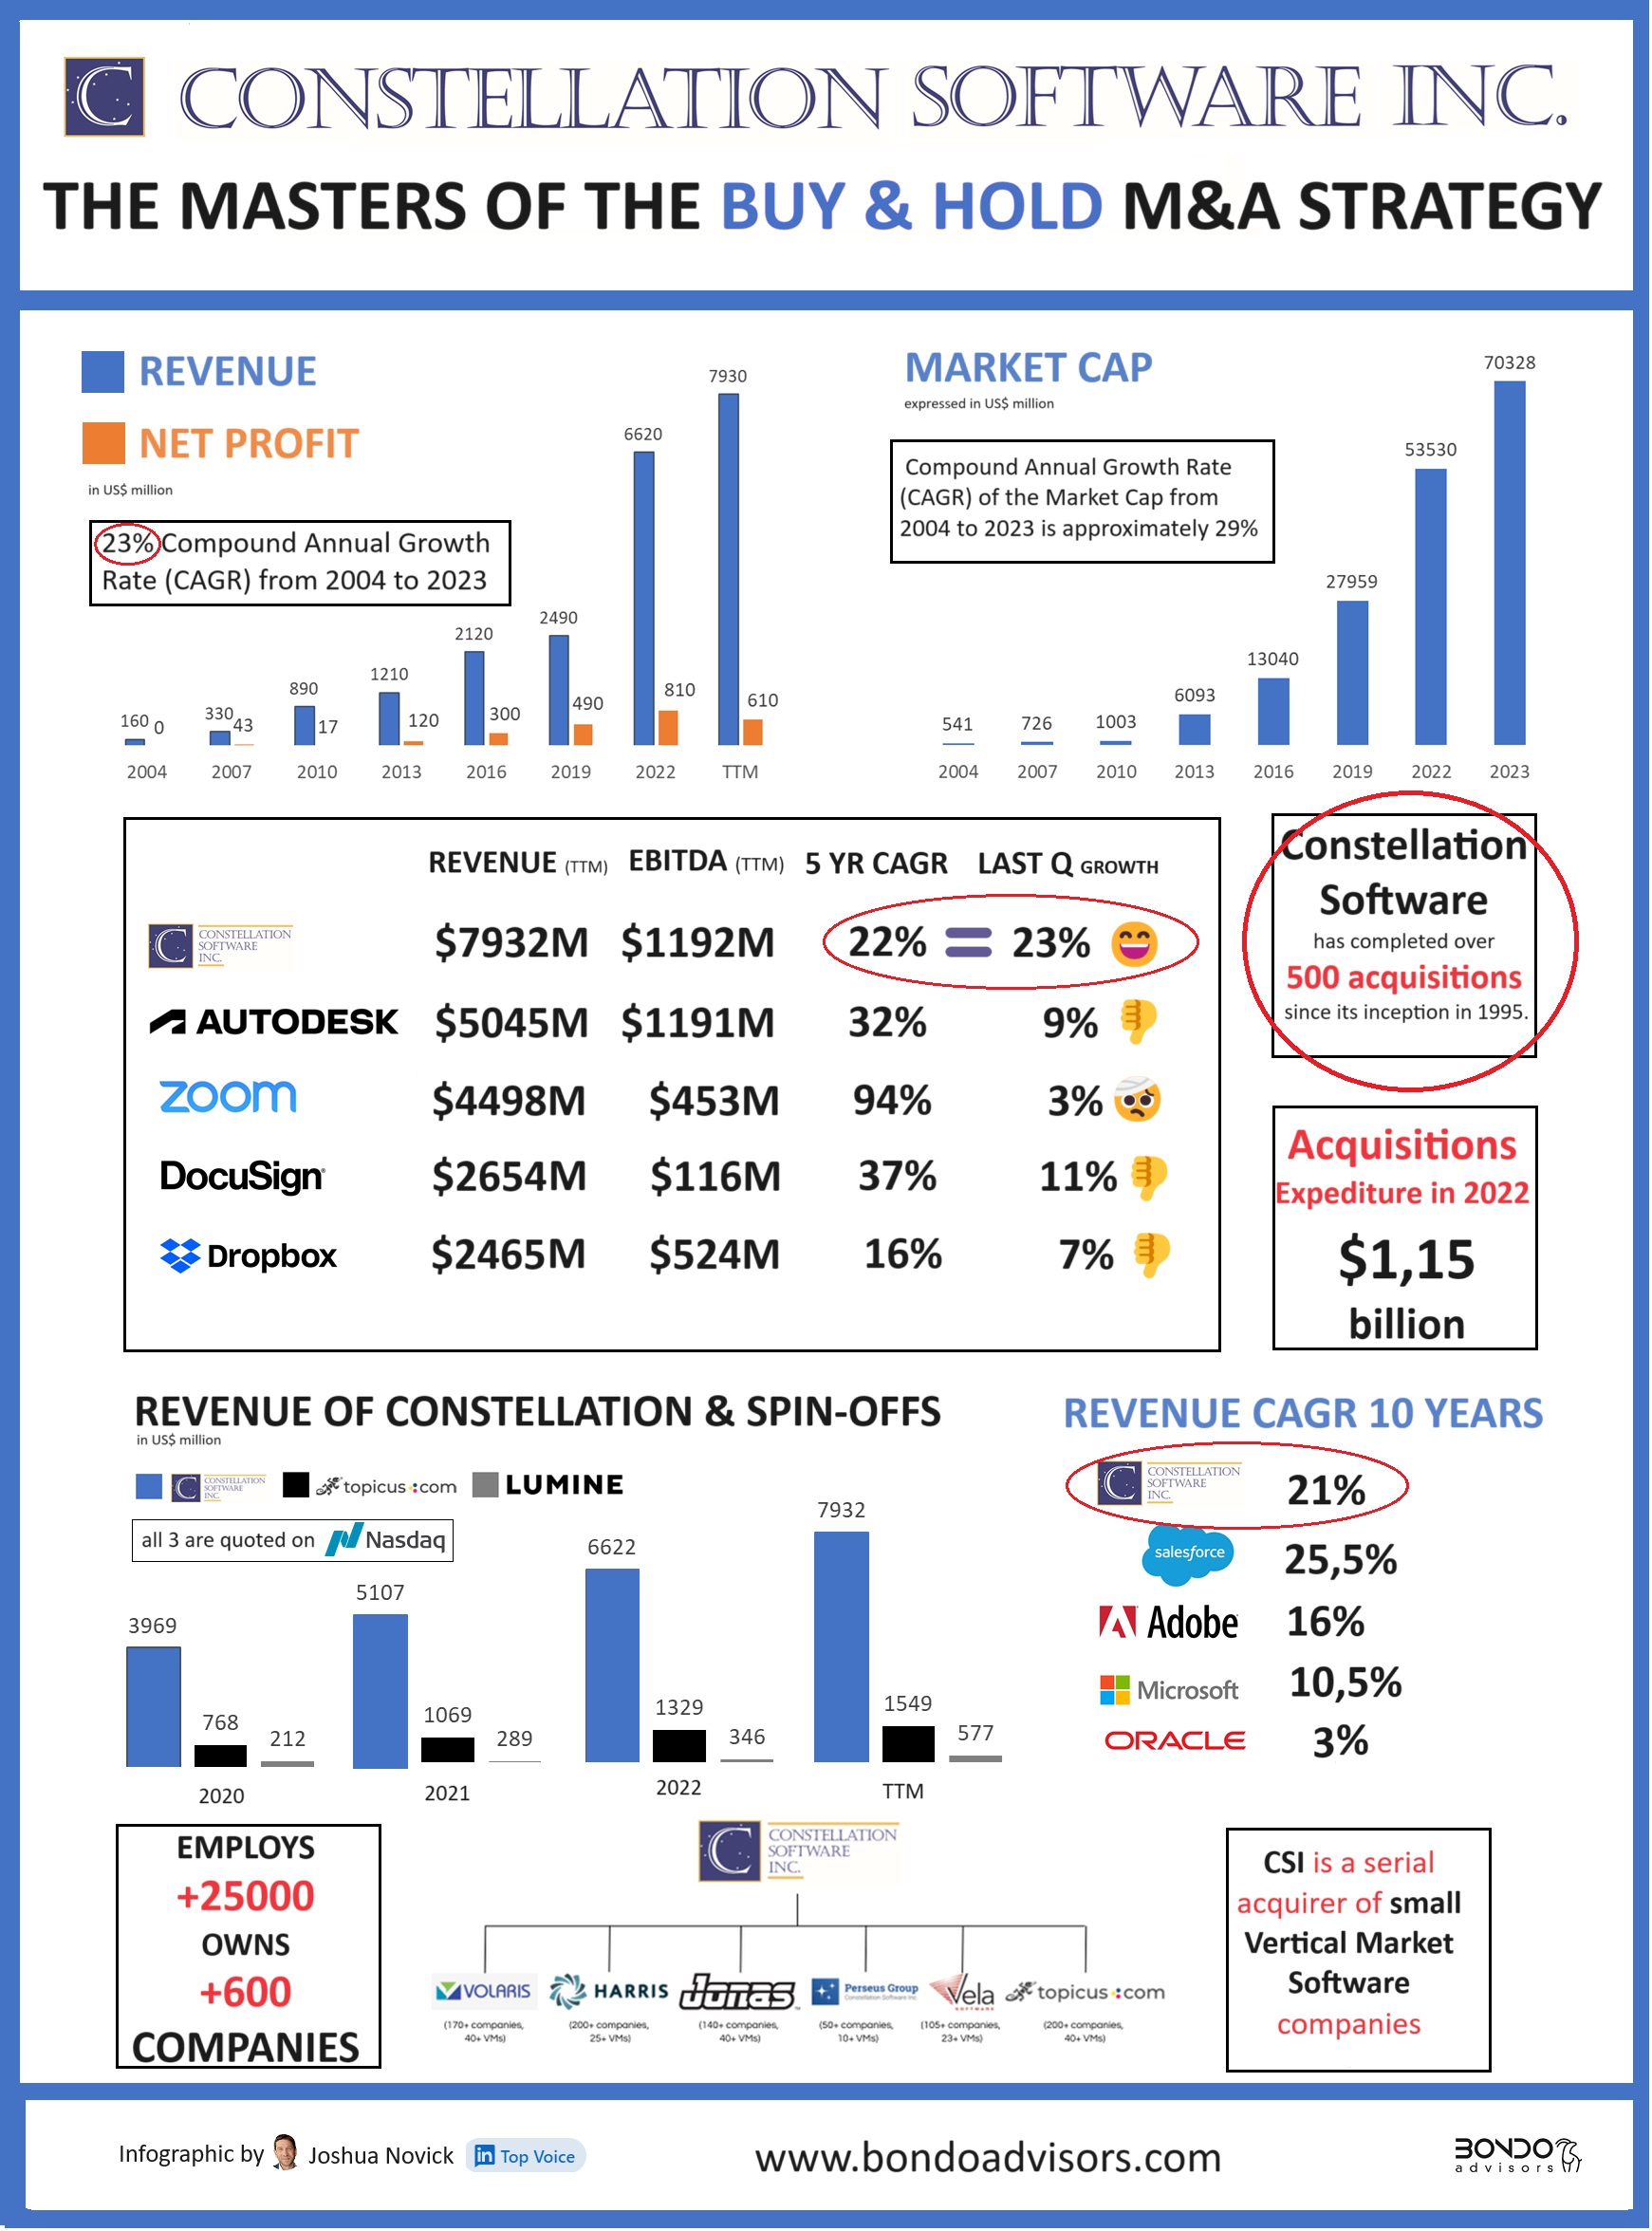
🔸$8B revenue and 1.2B EBITDA TTM
🔸23% Revenue CAGR for the last 20 years

Interestingly, Vitec Software Group, essentially the Swedish equivalent of Constellation, sharing the same acquisition strategy, is also on the list with a similar return: 166X in 15 years. This underscores that the «buy, grow and hold forever, small vertical software companies» strategy is a viable long-term business model 👍.

🌱Vitec is much smaller, with a $2B market cap, $230 million in revenue, and $85M in EBITDA over the past 12 months.

📺I ‘m extremely excited to see Netflix on the list 🎥. It’s incredible how this company evolved from selling CDs online to becoming the leader in streaming content, ranking as the 48th most valuable company with a $215B market cap.

Before its foray into streaming in 2007, Netflix was generating under $1B in revenue. Today, its revenue stands at $32B with $4.5B in net profit.

The journey through the remarkable financial achievements of these companies illuminates a path of strategic growth and innovation that has rewarded investors with returns once thought exclusive to the most speculative investments. From the protective film expertise of XPEL to NVIDIA’s GPU dominance fueling the AI revolution, and from Constellation Software’s aggressive acquisition strategy to Netflix’s streaming empire, these companies exemplify the potential of long-term value creation in diverse sectors. Their stories are a testament to the power of patient capital and the importance of recognizing underlying value in a market that’s often swayed by short-term trends. For those who look beyond the surface, the investment landscape is rich with opportunities for extraordinary growth and returns.
Read More
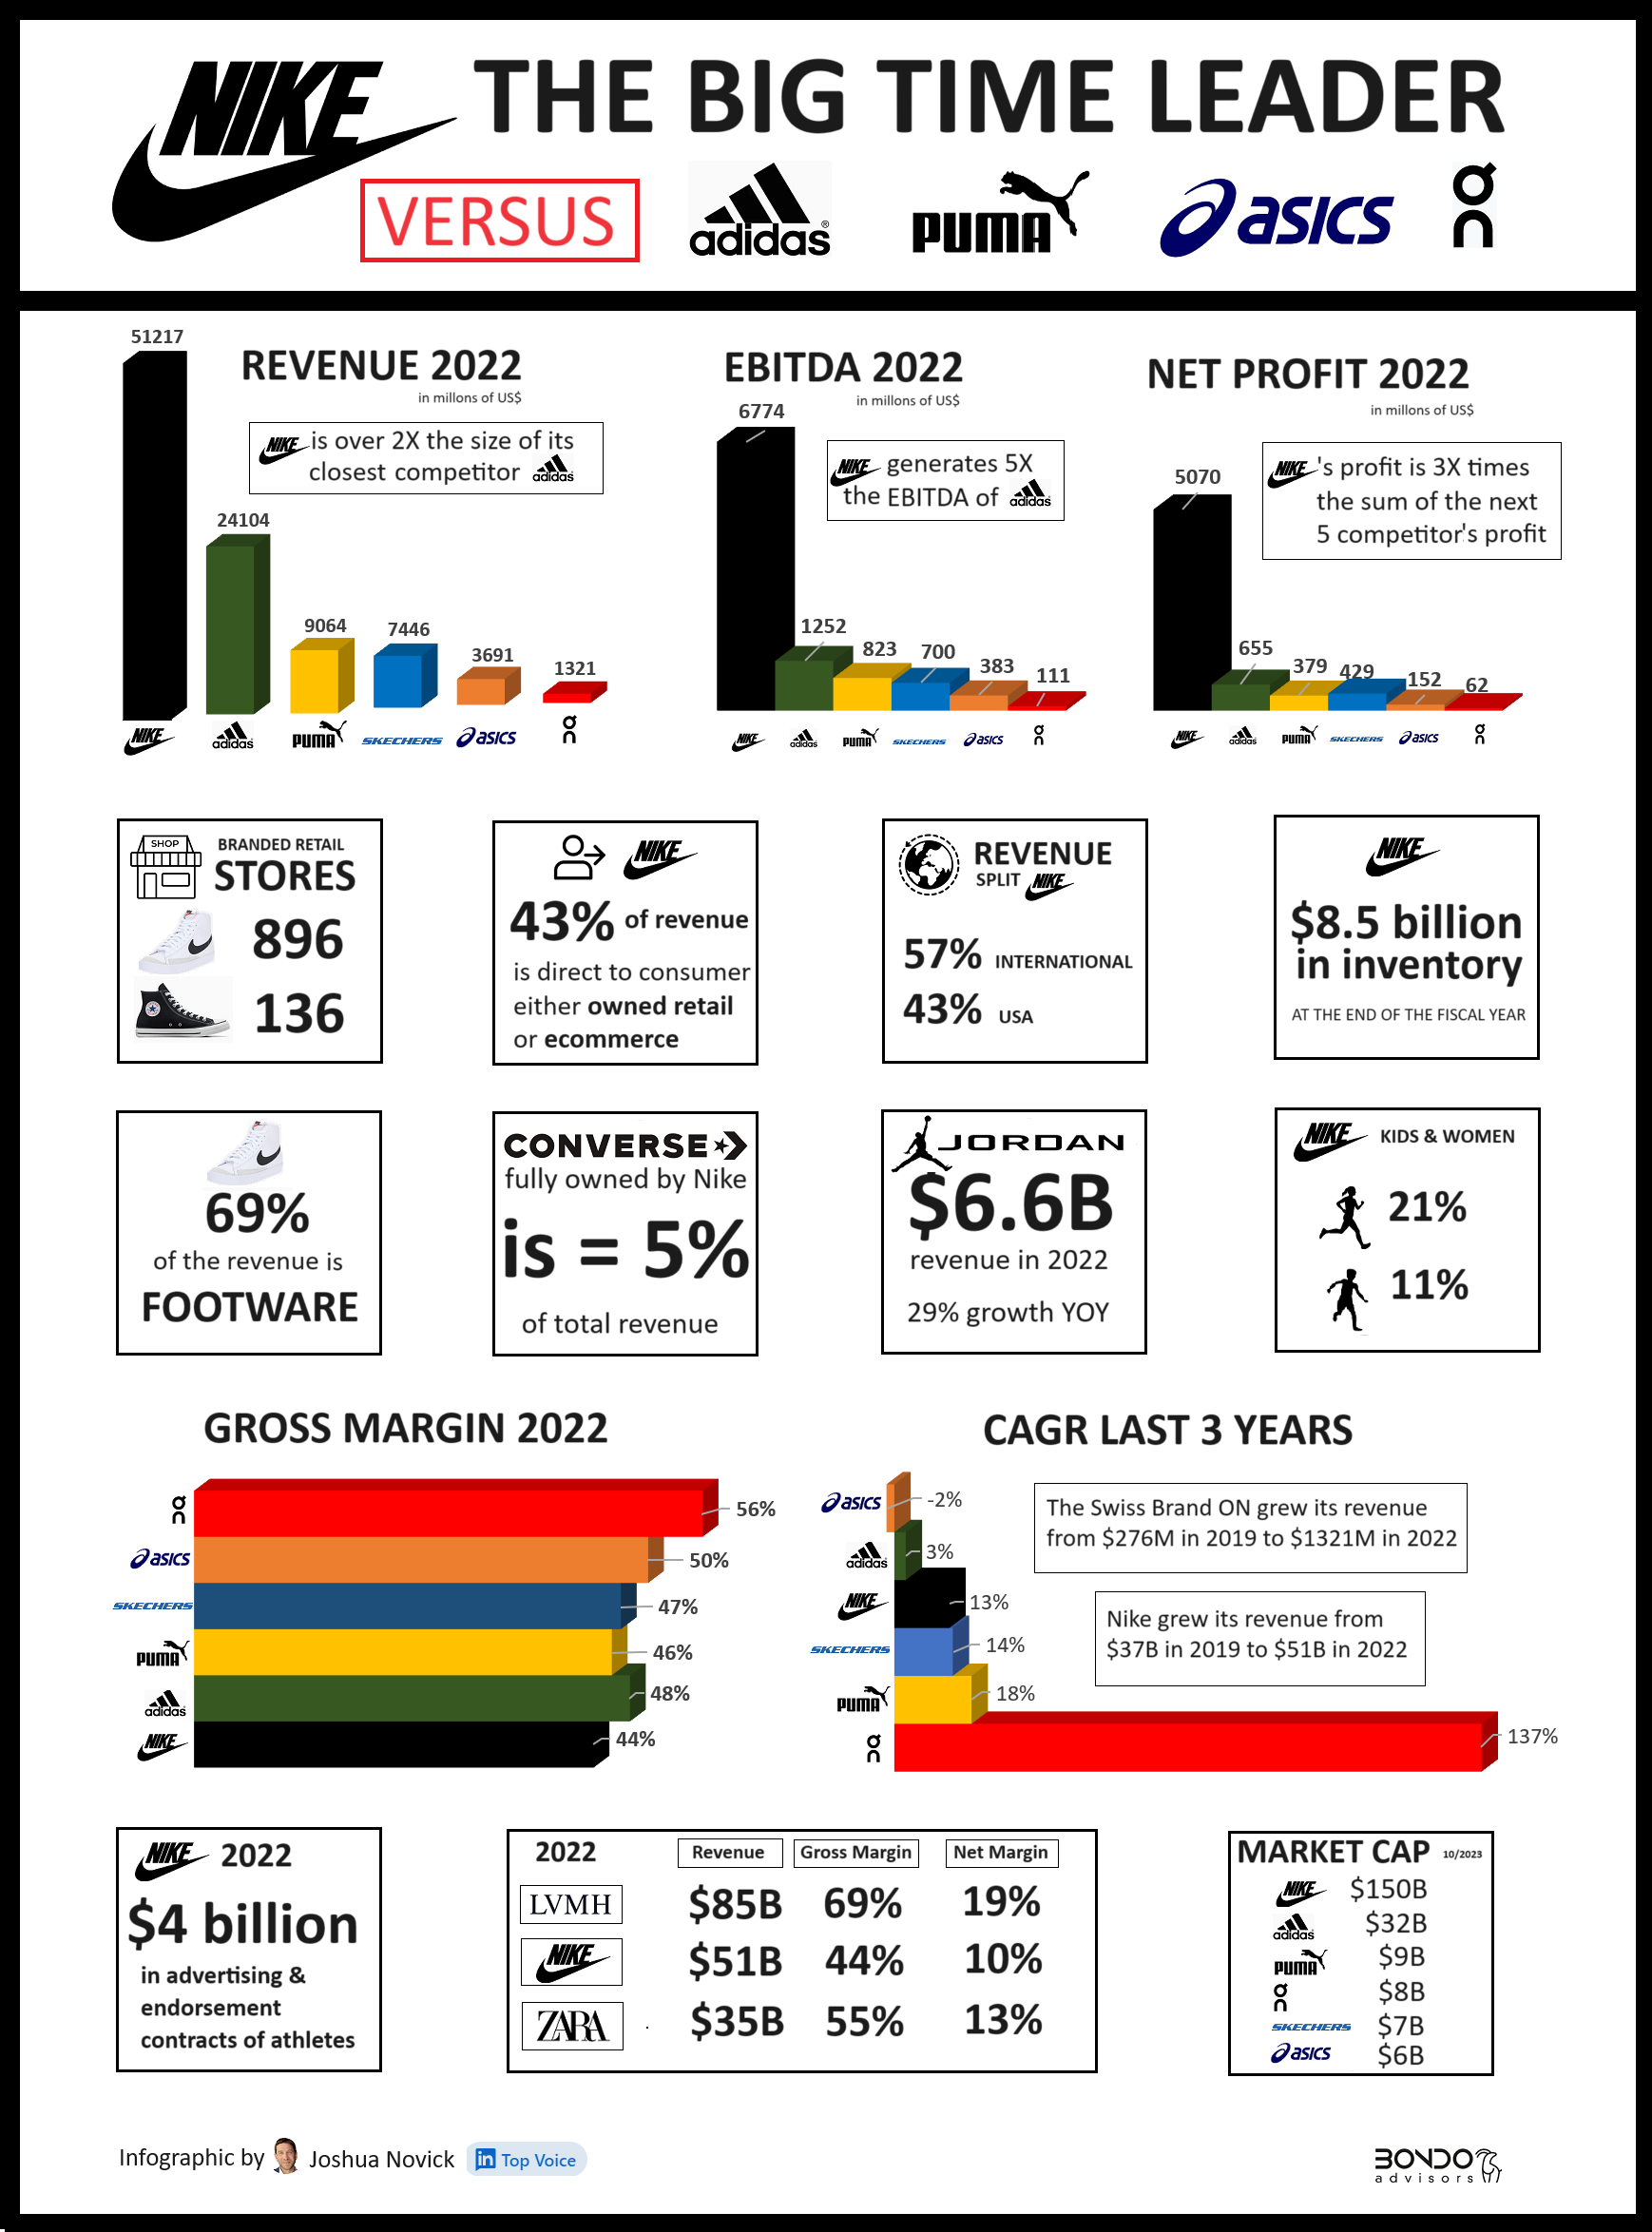
Nike versus Addidas

In the world of sports apparel and footwear, few names resonate as profoundly as Nike. This iconic brand has established itself as the second-largest apparel company globally, trailing only behind the luxury giant LVMH and surpassing renowned names like ZARA.

Nike’s journey from a humble distributor of Japanese running shoes to a behemoth in the apparel industry is a testament to its innovative strategies and relentless pursuit of excellence. In this in-depth analysis, we delve into Nike’s market position, financial performance, marketing strategies, and the unique history that shapes its current stature. From dominating sales figures to strategic endorsements and the story behind its sibling rivalry with Adidas and Puma, we uncover the facets that make Nike a leader in the global apparel market.

👟Nike is the second largest apparel business worldwide, just behind💎 LVMH (which is in the luxury category), and proceeding 👗ZARA SA

🧮Some numbers:

🔹Nike is by far the leader in the footwear and sports’ apparel segment. Nike’s sales are 2X adidas, almost 6X PUMA Group and 7X Skechers, and 14X ASICS Corporation.

🔹Interestingly it has the lowest gross margin of all its direct competitors (44%), trailing almost 12 percentage points from On in gross margin. It is also far behind LVMH (that has a mind blowing 69% GM) and even substantially below the fashion brand Zara (55% GM).

🔹Nevertheless, Nike is very profitable with a 13% EBITDA margin and 10% net profit margin. Substantially above Adidas (5% EBITDA margin and 3% Net Profit), Puma (9% and 4%), or Skechers (9% and 6%)

🔹Nike is growing at impressive rates: 13% CAGR in the past 3 years. Adidas only grew 3% CAGR in the same period and Asics -2% CAGR.

🎯Marketing:

🔹In 2022 Nike spent 💲4 billion on advertising and endorsement contracts of athletes (Adidas spends 💲2.7B) Nike’s marketing budget is greater than Asics total billings for 2022.

🔹Nike relies heavily on endorsement contracts with top athletes in basketball, tennis, and athletics, the three sports that use shoes that can be also be worn casually by consumers off the field.

🔹Through the 90’s Nike’s revenue was generated almost entirely via wholesalers and retail partners. The first Nike Store was opened in 1990. Since then, Nike has been ramping up its direct-to-consumer business that currently generates 43% of total revenue.

⛹🏿Air Jordan

🔹The Jordan brand ($6.6B in revenue in 2022 and 29% growth YOY) is now almost 3X the size of Converse ($2.4B revenue in 2022 and 3% growth YOY). Converse was bought by Nike for only $300M in 2003.

🔹Michael Jordan allegedly has a 5% royalty fee on all Jordan’s sales: that’s 💲330M in royalties just in 2022. WOW 🤯

💰Money:

🔹Nike was sitting on about $11B cash at the end of the last Q.

🔹Phil Knight, the founder, who retired as CEO in 2016, is still the largest shareholder of Nike, and is the 28th richest man in the world (Forbes) with a net worth of about 💲40B

👻Trivia:

🔹Adidas and Puma are actually “brother companies.” Adidas origin was founded in the 1920’s by Adi Dassler and Puma was founded 1948 by his brother Rudi Dassler (who left to start a competitor, Adi was not happy).

🔹Blue Ribbon Sports (the original name of Nike when it was founded in 1964) started as a distributer for the west coast for the Japanese running shoe brand Onitsuka Tiger (which today is ASICS Corporation). Blue Ribbon Sports started producing Nike branded shoes in 1971.

🔹Knight ran 🏃track at the University of Oregon and created Nike shoes with his former track coach, Bill Bowerman, who was obsessed with the competative edge shoes could provide to athletes.

🔹Puma’s largest single shareholder is Artemis, François Pinault’s luxury group which also owns Gucci, YSL, BALENCIAGA, etc.

Nike’s remarkable journey in the apparel and footwear industry exemplifies a blend of strategic marketing, relentless innovation, and a deep understanding of consumer needs. Despite facing stiff competition and market challenges, Nike has not only sustained its leadership position but has also exhibited impressive growth and profitability. The brand’s ability to adapt to changing market dynamics, coupled with its effective use of endorsements and direct-to-consumer strategies, continues to set it apart from its competitors. As we look to the future, Nike’s ongoing commitment to innovation and brand strength positions it well to remain a dominant player in the global apparel industry. The story of Nike is more than just a tale of business success; it’s a narrative of vision, resilience, and the relentless pursuit of excellence.

Read More
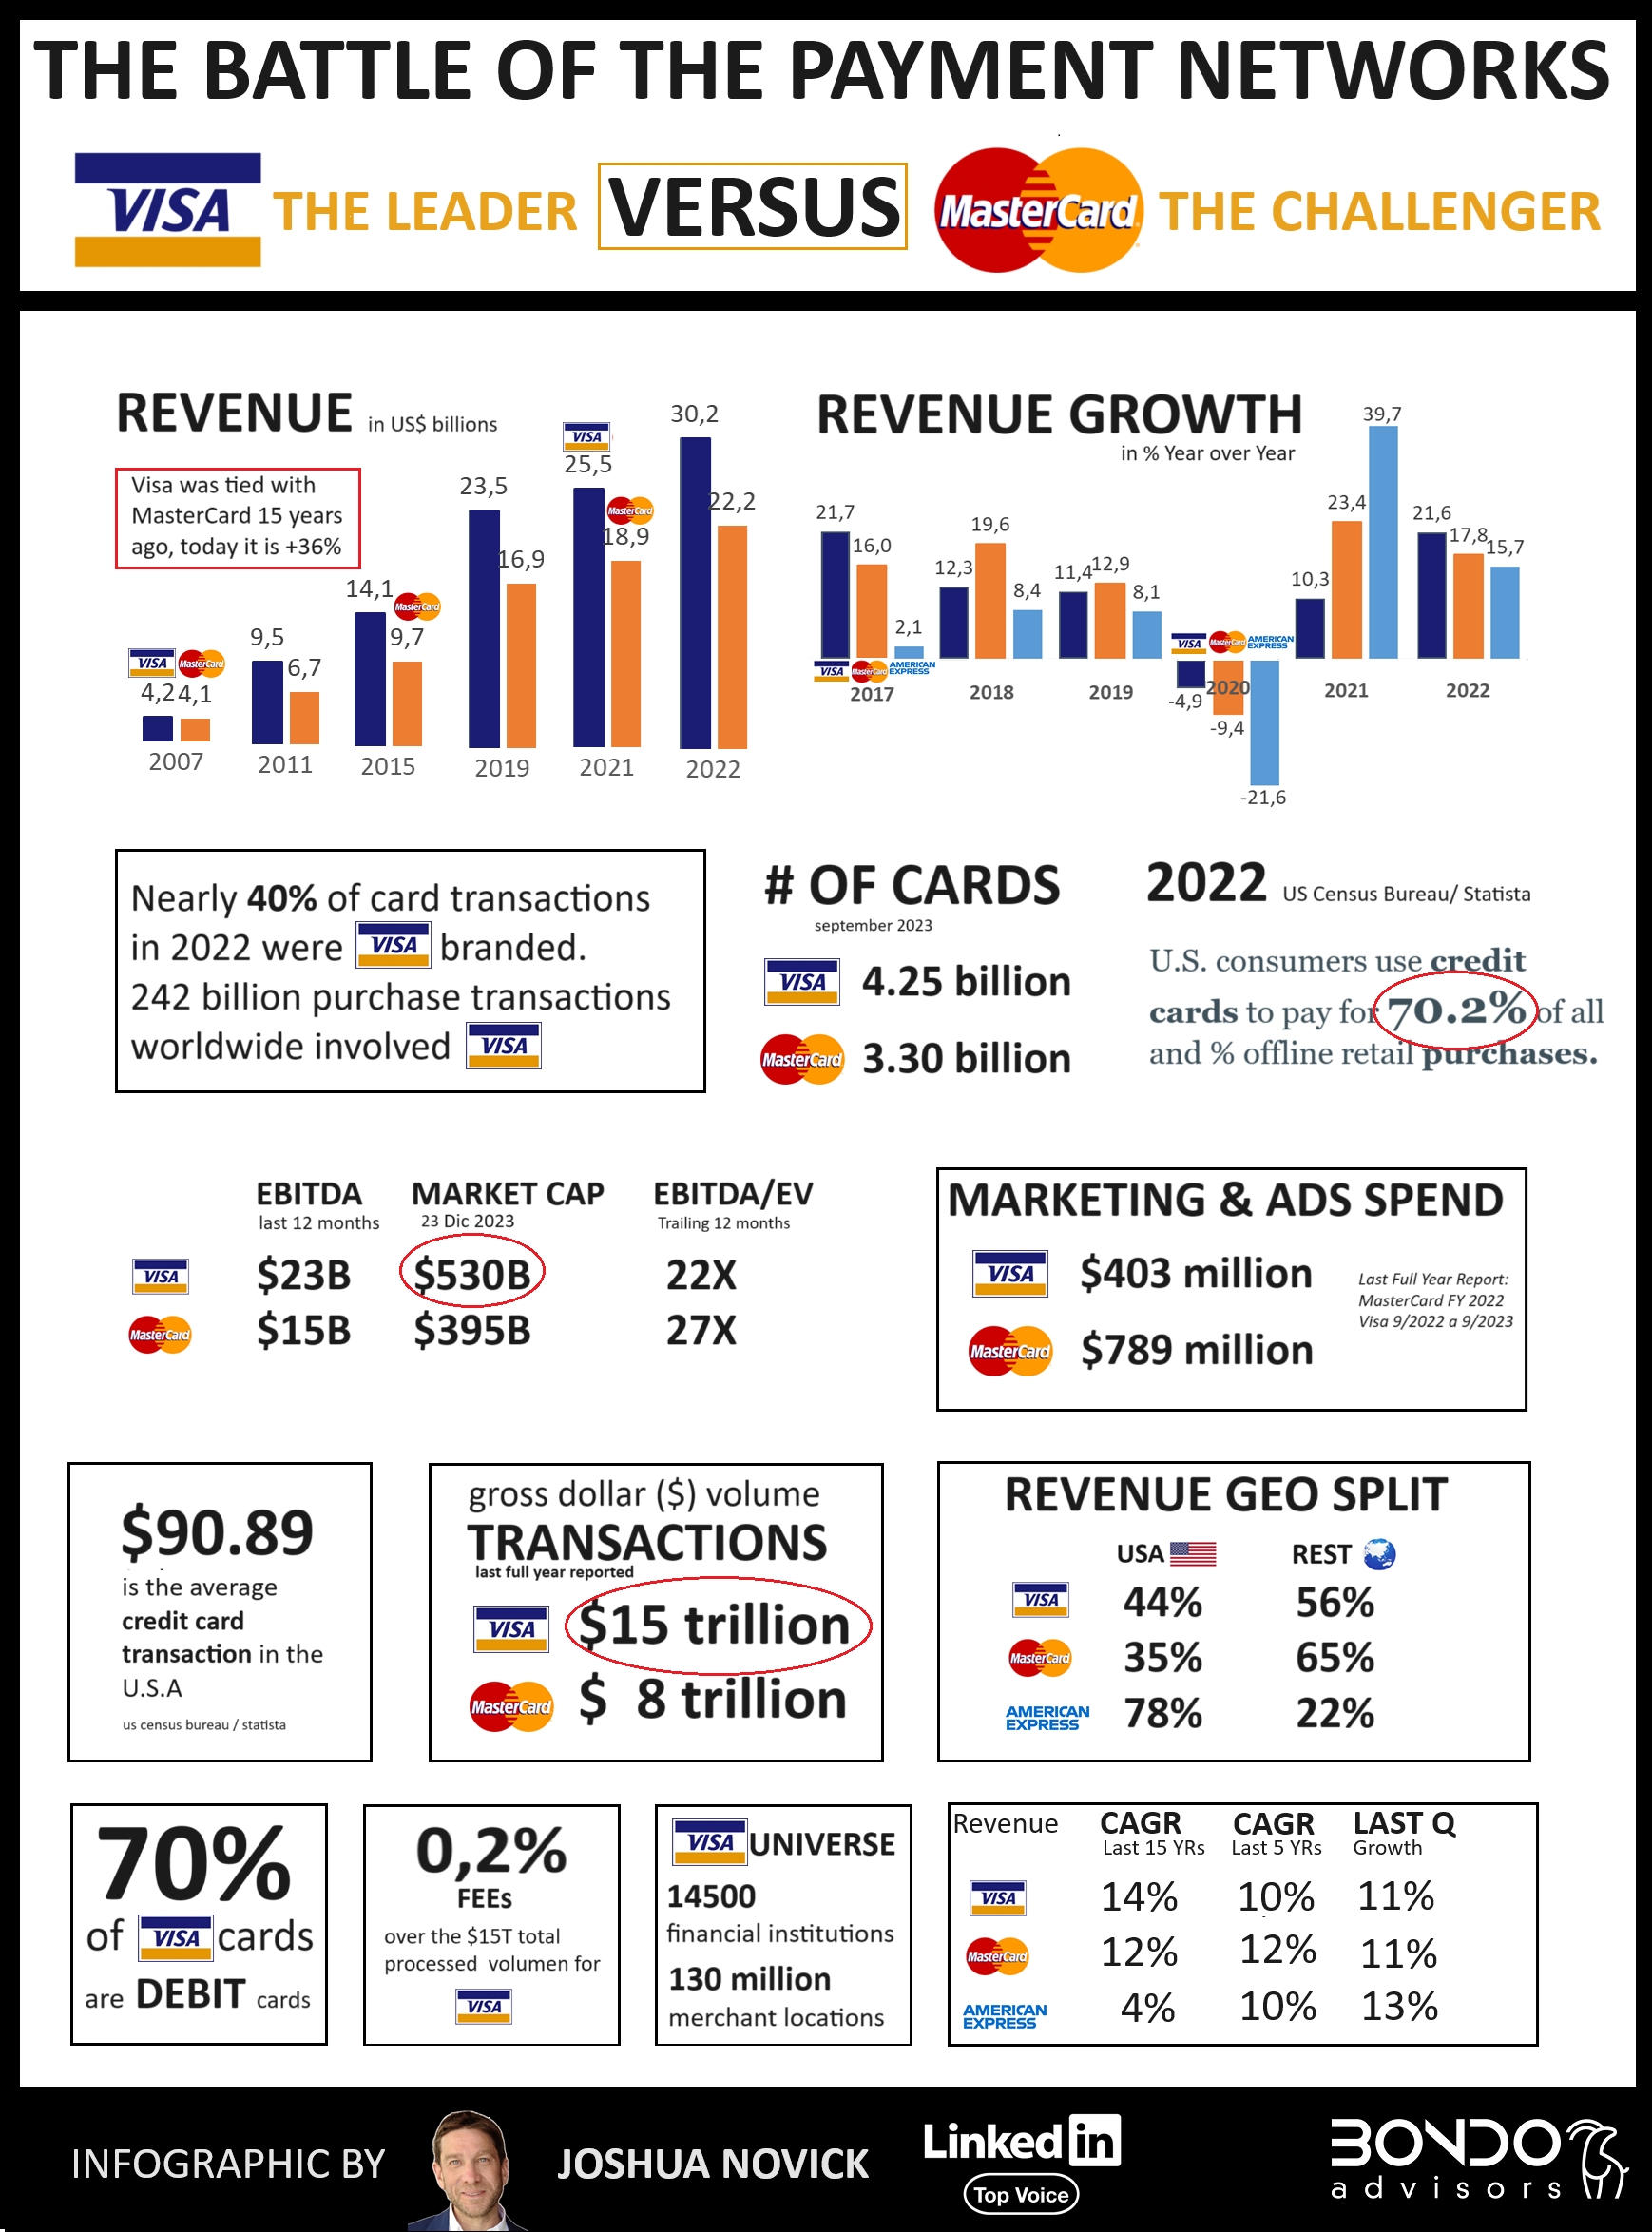
Visa versus Mastercard a comparison

Visa and Mastercard, two remarkable companies…

❌Are not banks
❌They don’t issue cards
❌They don’t provide credit &
❌They don’t have a direct relationship with consumers or merchants

They are basically hashtag#fintechs. Their role is to supply the technology and network infrastructure for banks to facilitate electronic transactions

Some Crazy Numbers:

🏆Visa ($530B market cap) is worth more than any bank (10% more than JPMorgan Chase & Co. $480B market cap) and is 12th worldwide in the hashtag#marketcap ranking.

💰MasterCard ($395B), is worth significantly more than the 2nd most valuable bank worldwide (Bank of America, $265B), over 3X times American
Express ($135B), and is 21st worldwide in the market cap ranking.

💵Visa’s EBITDA margin on revenue for the trailing 12 months was an astounding 70%, while Mastercard’s was 60%. Their EBIT margins were 67% and 57%, respectively. In comparison, among megacaps, only the Taiwanese semiconductor manufacturer TSMC, with a 68% EBITDA margin, rivals Visa and Mastercard in this metric, though it has a considerably lower EBIT margin of 46%. Saudi aramco’s EBITDA margin is 54%, Microsoft is at 50%, NVIDIA 49%, Meta (Facebook) is 43%, Apple 33%, and Google 32%.

🥇Visa and Mastercard managed over💲23 trillion in gross transactions in 2022 (almost the size of the US GDP which was $25Tin 2022🤯 )

Growth Prospects:

🌬️Visa and Mastercard have benefited from significant tailwinds. Factors such as the rise of 🛒 ecommerce, COVID, increased preference for card over cash transactions, and government initiatives promoting electronic payments to combat tax and VAT fraud have all played a role.

🌱There’s still significant room for growth in areas like traditional retail, expansion of ecommerce, & the transition of B2B or larger transactions to electronic formats.

⚠️Threats to Consider:

🔏Regulatory Challenges:
there is a possibility that governments might attempt to break up the Visa and Mastercard duopoly

🌏Rising Competitors:
China UnionPay, Alipay, and WeChat: In China, a near-cashless society, over 80% of daily consumption transactions occur on hashtag#mobile platforms, primarily through Alipay and WeChat Pay, which hold a combined 91% market share

UnionPay accounted for 40% of global debit card purchase transactions, surpassing Visa (2022 Nielsen Report). UnionPay International has expanded globally, partnering with over 2,500 institutions and enabling card acceptance in 181 countries, with issuance in 79 countries.

🍎ApplePay and GooglePay: Currently serve fundamentally as wallets for Visa and Mastercard cards, and lack direct merchant relationships. But what could happen if they acquired someone like Square or PayPal (which have established merchant networks)?

🖍️PayPal: Presently processing «only» $1.3 trillion in transactions (although a significant increase from $150 billion a decade ago). PayPal could still emerge as a competitor in the future, but has a long way to go…

Read More
Unilever versus Procter & Gamble

In the fiercely competitive industry of consumer goods, two giants stand out: Procter & Gamble (P&G) and Unilever. As leaders in the industry, they command significant attention from investors, consumers, and market analysts alike. This post delves into a detailed comparison of these two titans, exploring their similarities, differences, and the unique strategies that have shaped their market presence. With P&G and Unilever’s revenue, brand strategy, and global footprint at the forefront, we’ll unravel the intricacies that define their dominance in the market. Join us as we dissect the financial prowess, investment strategies, and market perceptions that set these two behemoths apart, offering invaluable insights for investors, business enthusiasts, and market watchers.

Let’s dive into the showdown 🤼 between these titans and see what sets them apart.

Let’s start with what the have in common:

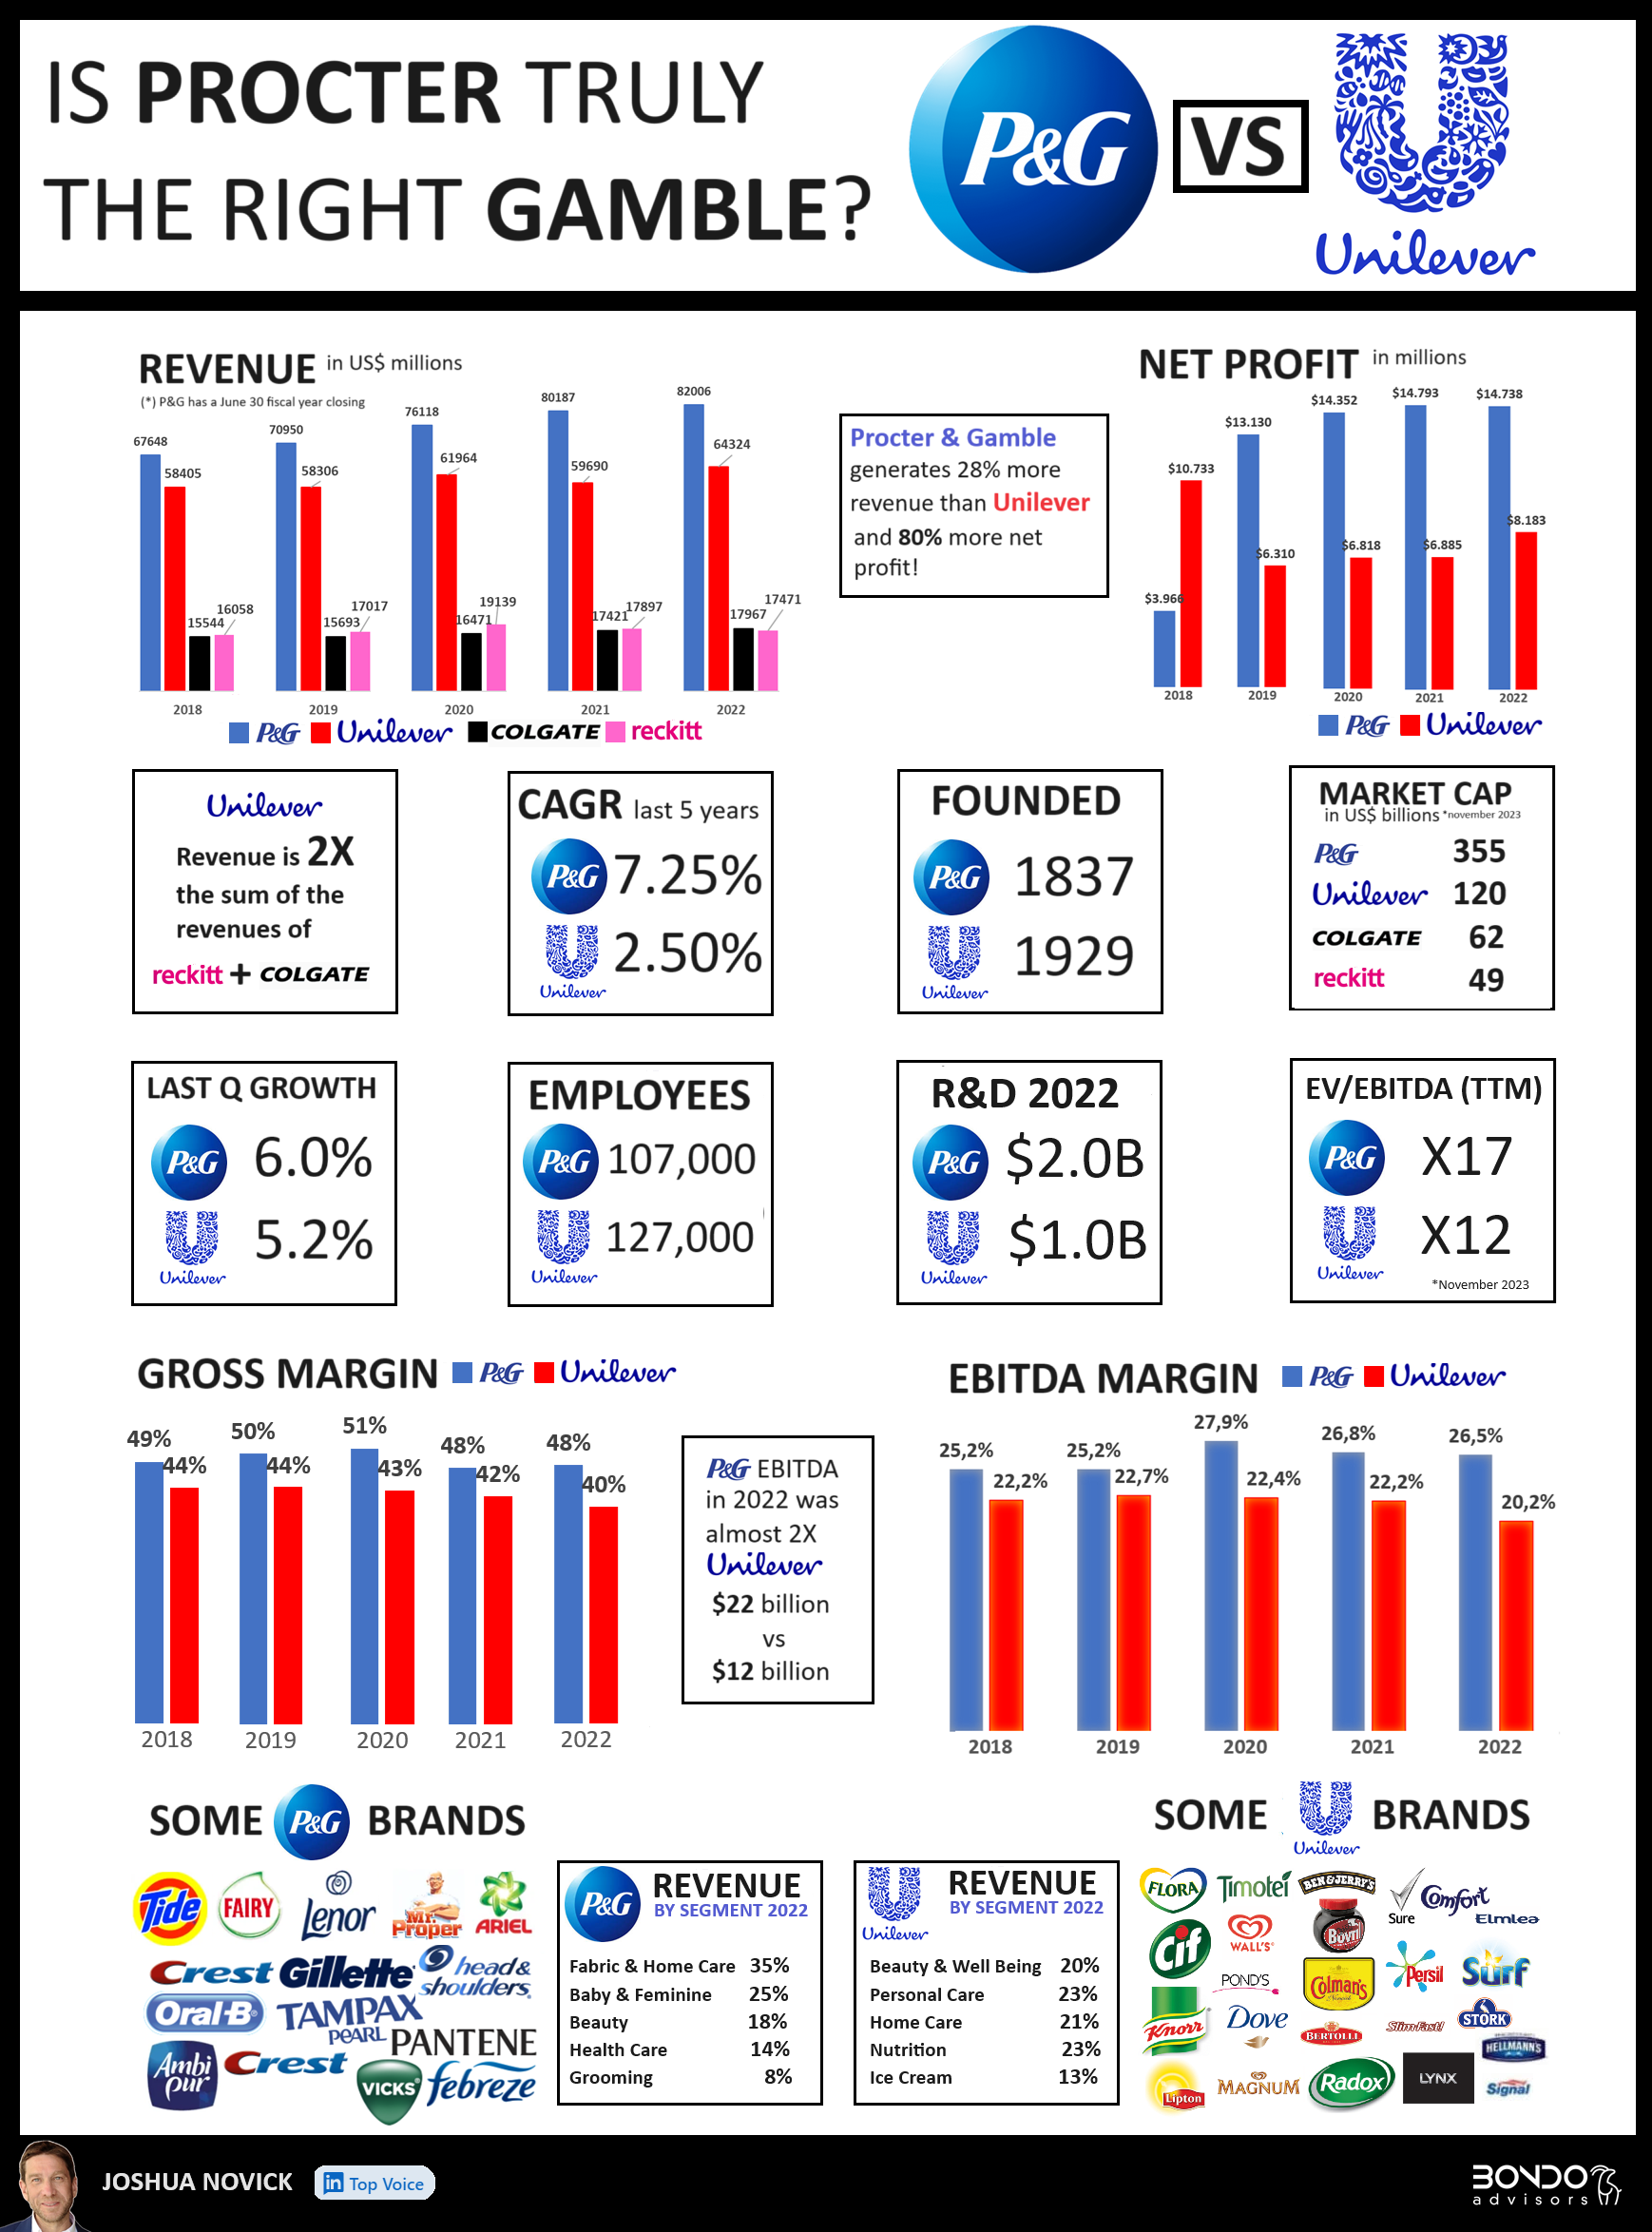
✅They are worldwide leaders in consumer goods. P&G’s revenue ($82B in 2022) is equal to the sum of Henkel ($22B revenue), Kimberly-Clark ($20B), Colgate-Palmolive ($18B), Reckitt ($17B) revenue.

✅They have a global footprint but with brands and products often adapted to the local tastes of consumers.

✅Both companies have grown through a combination of acquiring existing successful brands and developing their own new brands.

✅Both build brands through titanic investments in marketing. In 2022, Unilever spent $7.8B (13% of revenue) on Brand and Marketing, while P&G spent $8B (10% of revenue).

✅Both are huge free cash flow machines: Unilever ($5.2B in 2022) and P&G ($16.8B in 2022).

How are they different?

❎P&G is a pure player in home care and personal care. It was founded by two brothers-in-law, William Procter, a candle maker, and James Gamble, a soap maker when they formed a partnership back in the early 19th century.

P&G’s breakdown of sales:

🔸Fabric & Home Care: 35% of sales
🔸Oral Beauty and Personal Health Care: 32% of sales
🔸Baby, Feminine & Family Care: 25% of sales
🔸Grooming (Gillette): 8% of sales

❎Unilever, on the other hand, was the merger of two companies in 1929: Margarine Unie, a Dutch margarine producer, and Lever Brothers, a British soap maker.

It competes with P&G in

🔸 Personal Care (23% of sales),
🔸Home Care (21%), Beauty (20%),
🔸but also has a strong presence in the food segment (36% of sales) as an inheritance of its margarine maker origin.

❎Both companies invest substantially in R&D, but P&G invests ($2B in 2022), twice as much as Unilever ($1B).

❎Both companies are global, but P&G is still very US-dependent (44% of 2022 revenue). North America represents 50% of all sales, Europe 21%, China 9%, Asia & Pacific 8%, Latin America 7%, India + Middle East + Africa 5%.

❎Unilever’s revenue is more global: the US is only 20% of sales. Asia/Pacific/Africa represents 46% of sales, Americas 34%, and Europe 20%.

❎Unilever is still only about half the size of P&G (if you exclude their business in food/nutrition where they compete with giants like Nestlé, Danone, etc…)

❎P&G (almost $15B Net Profit in 2022) is substantially more profitable than Unilever ($8B Net Profit). Almost 2X

❎P&G has grown almost 3 times faster than Unilever in the past 5 years: respectively 7.25% CAGR and 2.5% CAGR.

❎P&G is the sweetheart of investors. Its market cap is 3X Unilever.

💵Unilever is currently trading at 12X EV/EBITDA (TTM) and 2.2X Sales (TTM)
💰P&G is trading at a super premium 17X EV/EBITDA (TTM) and 4.5X Sales (TTM)

Investors seem to believe P&G has a clear edge over Unilever going forward.

Is Procter really such a a good gamble❓

The comparison between P&G and Unilever reveals a fascinating narrative of corporate strategy, market positioning, and financial performance. While both companies share commonalities in their global influence and brand-building prowess, their distinct approaches to product diversification, R&D investment, and geographical focus highlight the uniqueness of their paths to success. P&G’s more concentrated business model and higher profitability juxtaposed with Unilever’s diversified portfolio and global spread illustrate varied paths to success in the consumer goods sector. As the market continues to evolve, the question remains: will P&G maintain its edge, or will Unilever’s diversified approach yield greater benefits in the long run? Only time will tell which strategy will prove to be the most effective in the ever-changing landscape of global consumer goods.

Read More
Instacart IPO, revenue, EBITDA, average order and gross transactional value

In the constantly changing and rapidly progressing world of online food and grocery delivery services, recent developments have raised critical questions about the sustainability and profitability of this sector. Major players like Getir, DoorDash, and Delivery Hero have faced significant challenges, with declining valuations and substantial losses marking a turbulent period. However, amidst these struggles, Instacart’s success story offers a glimmer of hope and valuable insights. This analysis delves into the current state of the online food delivery industry, examining the contrasting fortunes of these companies and exploring the key factors that could determine their future viability and success.

The fast-track grocery delivery service Getir just announced it had to slash its valuation to less than 1/4th, from its peak valuation 18 months ago,(from $12B to $2.5B) in order to raise the additional $500M it needs to stay alive.

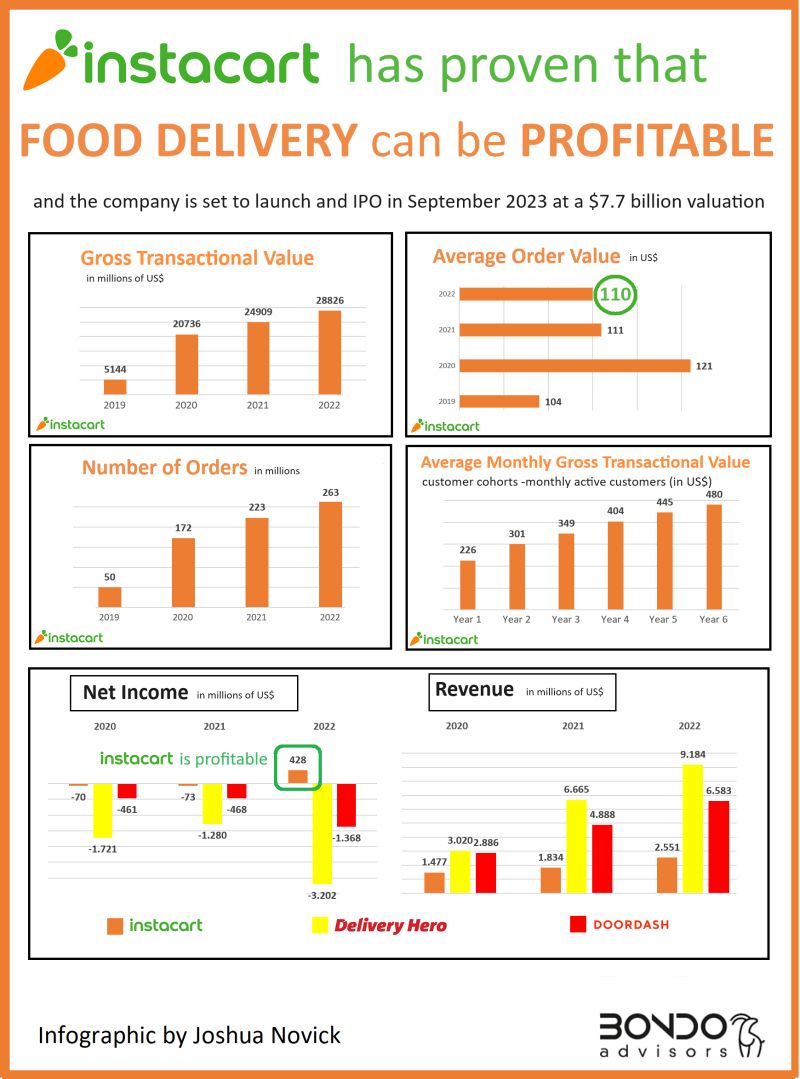
US food delivery leader, DoorDash lost a record $1.4 billion in 2022, and German category champion Delivery Hero lost $3.2 billion in the same year.

Both companies have been struggling to find a path to profitability, and despite all their effort in the 1st half of 2023 DoorDash reported a loss of $331M and Delivery Hero reported losing €820 million euros

Is there hope for the online food delivery services❓

Yes, maybe 😉

Especially if you look at what Instacart has achieved: $420 million net profit in 2022!

Ok, Instacart is not exactly in the same space as the rest.

Instacart delivers grocery to consumers from partner grocery stores, same day, but not super speedy (which makes logistics a lot simpler)

Getir delivers grocery from their own dark stores in 30-minutes

DoorDash and Delivery Hero also deliver grocery, but their main business is delivering to-go meals from restaurants to consumers.

What are some of the keys to Instacart’s profitability❓

🔑The average order of Instacart is $110. That is over 3 times the average order value of DoorDash, which was around $32 per order in 2022.

If you look at the unit economics of a Instacart typical $110 order, it looks like this:

Fees:

💲7 —Instacart charges the retailer an average of 6.3% fee
💲0,40— Instacart charges the consumer an average of 8.6% delivery fee. The delivery fee goes almost completely to the “shopper” (the «rider») which makes an average of 8.2% of the order value.

Advertising


💲3 —Instacart also generates about 2.6% order value in advertising

Total Revenue per order:

💲10.5—- Revenue (after delivery cost) = 9.5% of Average Order


❌On the other hand my bet is that Getir will never be profitable. There just is not enough demand for 30-minute grocery delivery. I mean, there is not just enough demand for super fast delivery at the price a consumer would need to pay. Getir and Gorillas grew only because they were “dumping” a service at a huge unit-economics loss.

✅On the other hand, the service Delivery Hero, DoorDash Glovo, Deliveroo (etc) provide is something that enough consumers want /need. There are enough consumers willing to pay for this service at a “fair price.”

The clue to success is Instacart’s revenue.

Instacart’s revenue is less than 1/3 of Delivery Hero’s revenue, but it is nicely profitable.

Why is revenue a clue❓

🗝️Very simple. In order to be profitable, food delivery services will need to cater their services only to those consumers who are willing to, either pay much higher delivery fees, or make much larger orders. Unfortunately, that is only a portion (30% or 50%?) of their current customer base, but my bet is that it still is a huge total addressable market and opportunity.

The contrasting fortunes of companies like Getir, DoorDash, Delivery Hero, and Instacart in the online food delivery sector highlight a pivotal moment for this industry. While the struggles of some companies underscore the challenges of achieving profitability in a competitive market, Instacart’s profitable model provides crucial lessons. The key to sustainability lies in targeting consumers willing to pay higher delivery fees or place larger orders, a strategy that may shrink the customer base but still taps into a significant market opportunity. As the industry continues to evolve, these insights could be pivotal in shaping the future of online food delivery services, balancing consumer demand with the imperative of financial viability.

Read More
ideas on how to negotiate a successful M&A sell side deal

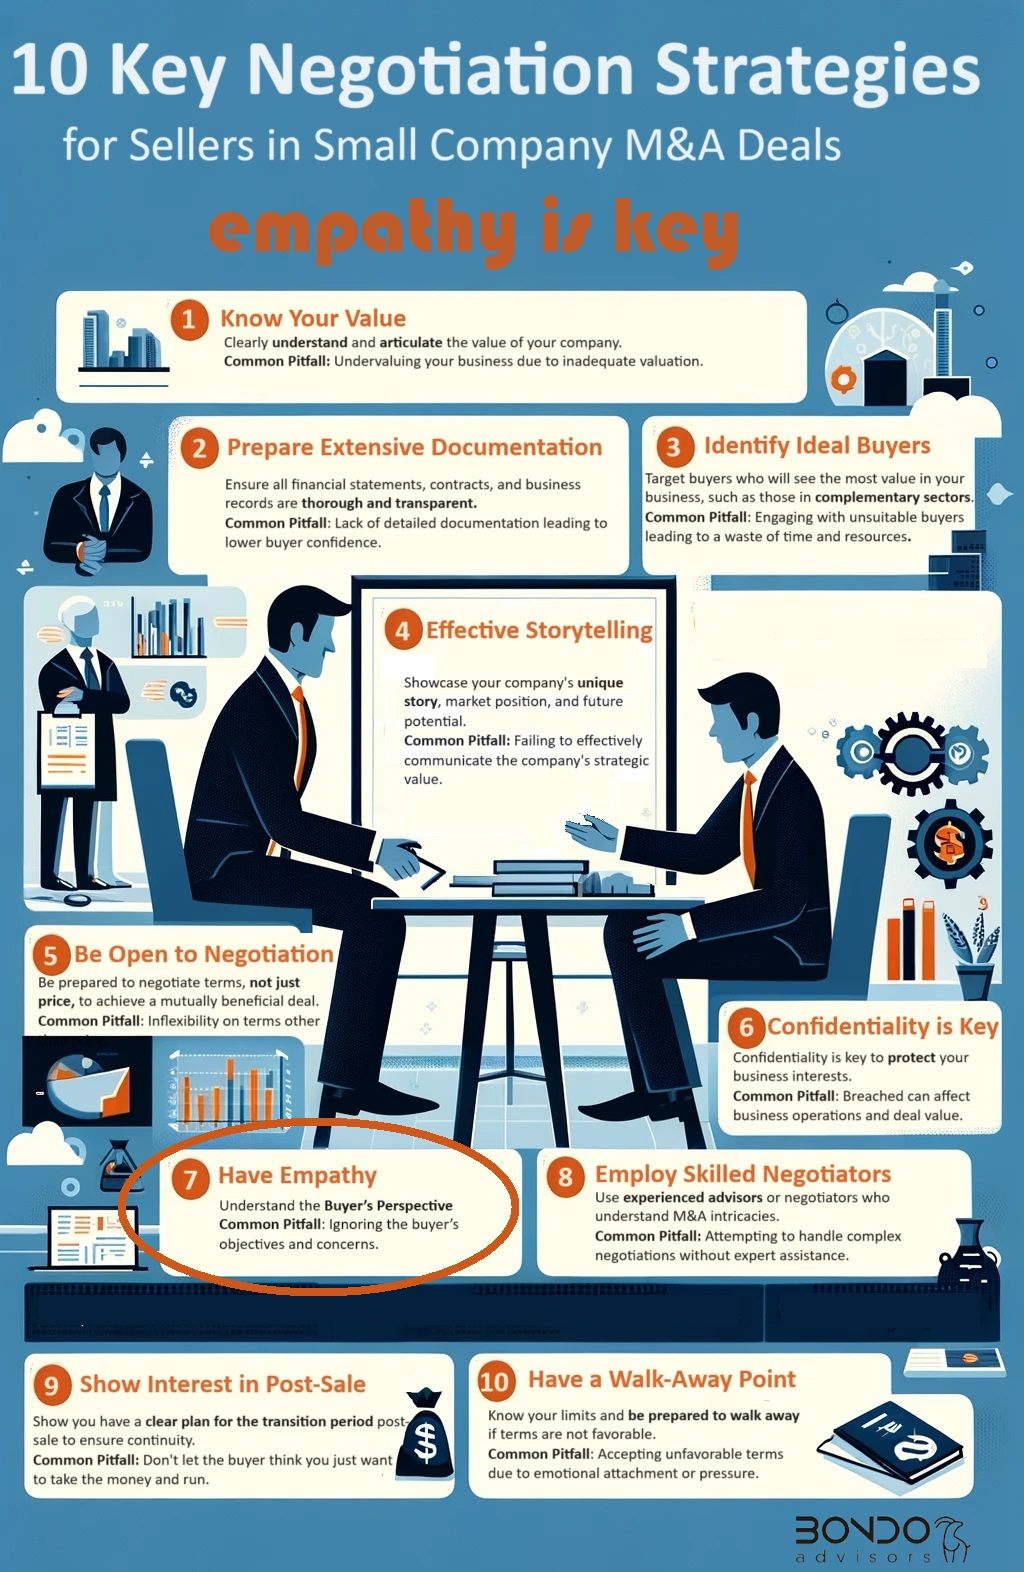
Empathy. Not just any empathy, but a strategic and informed empathy that underpins effective negotiations in M&A transactions.

I’m not talking about the kind of Christian empathy rooted in compassion, selflessness, and benevolence. While these are noble traits, a overly Christian approach will probably result in a bad deal.

Instead, I refer to the concept of empathy as defined by Alfred Adler: «seeing with the eyes of another 👀, listening with the ears of another 👂, and feeling with the heart of another ♥️.»

👥This approach is crucial in sell-side M&A. It’s not just about marketing your company; it’s about engaging in a dialogue. Ask probing questions to different C-level executives and stakeholders on the buyer’s side to gain a comprehensive understanding.

Why are they interested in acquiring a company❓
What specific attributes make your company a compelling target❓
What standalone risks and opportunities do they foresee❓
Post-transaction, what could potentially go wrong❓
What are the inherent risks of the deal itself❓

✅Effective negotiation goes beyond hashing out terms and clauses. It’s about addressing the fundamental risks and aligning the transaction with the goals of all parties involved.

✅When you understand the buyers fears and goals you can work on solutions that can protect both parties.

🔸For example, consider the negotiation of an earn-out clause. As a seller, your initial goal might be to secure as much of the payment upfront at closing, while the buyer prefers a variable payment. To effectively negotiate, it’s crucial to understand the buyer’s rationale. Why are they insisting on a variable payment, and why is it based on a specific P&L item, such as EBITDA?

🔸By asking targeted questions and actively listening, you might discover that the buyer’s concerns stem from doubts about the feasibility of projected synergies, or worries that key management might depart absent a significant variable compensation component.

🔸So, how can you, as a seller, address these concerns without bearing the risks associated with an EBITDA-based earn-out, which encompasses uncertainties in revenue, cost factors, and potential disputes over EBITDA calculations❓ One strategy could be to propose an earn-out based solely on achieving specific cost-saving targets, which are generally more predictable than revenue synergies. Additionally, offer bonuses contingent upon management’s continued engagement and positive performance within the company.

🔸When presenting this counterproposal, frame it empathetically: «I understand your concerns about [XYZ]. To address these, I’ve considered an alternative approach that might alleviate these issues…'»

💊By aligning your proposal with the buyer’s fears and objectives, you create a win-win scenario, making the deal more appealing and grounded in mutual understanding.

The essence of successful sell-side M&A lies in the ability to transcend basic negotiation tactics and embrace a strategic empathy that resonates with buyers’ concerns and objectives. By asking targeted questions, actively listening, and aligning proposals with the buyer’s perspectives, sellers can forge win-win scenarios that go beyond mere transactional gains. This approach not only mitigates risks but also fosters a deeper understanding and alignment of goals, thereby enhancing the overall efficacy and success rate of the company sales process. In the ever-evolving landscape of M&A, empathy, when strategically applied, is not just beneficial—it’s essential.

Read More
Constellation Software: the M&A Rollup Machine

In the fast-paced realm of technology, there are giants whose names echo in every corner of the industry. Yet, there exists a titan that operates with such finesse and strategy that it might have slipped under your radar – Constellation Software Inc. This tech behemoth, often unrecognized in the mainstream media, has been quietly revolutionizing the software world with its unique business model and impressive growth trajectory. Let’s delve into the intriguing journey of Constellation Software, a company that has mastered the art of growth while maintaining a surprisingly low profile.

🛒 Constellation is a Voracious Acquirer: In < 30 years it has acquired +500 software companies.

🤫 Under the Radar: Despite its low public profile, it markets around 600 different software solutions across numerous industries.

🕵️‍♂️ Unlike a PE Firm: In contrast with Private Equity, Constellation Software holds companies «forever,» focusing on long-term growth.

💡 Unique Acquisition Strategy:

▪️Targets small software companies (even as low as $1M in revenue) and only occasionally larger ones (even a few hunded million in revenue)
▪️Funds acquisitions through business cash flow, sometimes using debt.
▪️Prefers bootstrapped over VC-funded companies.

📈 Super Growth:
Last 12 months’ revenue: ~💲8 billion and 💲1.2 billion EBITDA. To put that into context the revenue is 3X DocuSign or Dropbox’s!

📊 2022 growth: 30% (Organic growth: -1%).
▪️Consistent growth. The company has been growing steadily for the past 20 years at a 23% CAGR.
▪️Last 10 years, 21% CAGR, Last 5 years 22% and last Q 23%. Hard to be more predictable!

💹 Revenue Breakdown:

▪️Maintenance/recurring fees: 70%
▪️Software license fees: 5%
▪️Professional services: 21%
▪️Hardware sales: 4%

👥 Staff & Marketing:
Staff costs: 71% of expenses, 54% of revenue.
Sales and Marketing: Only 7% of revenue.

📣 Advertising: 💲86M in 2022 (1.3% of revenue). So no going crazy buying Google Ads to generate leads and sales…

They just buy companies to grow 🙃

🌎 Geographic Reach:
USA & Canada: 60% of revenue.
Europe: Nearly 30%.

The success of the model (Constellation trades at 7✖️ 12 months trailing revenue and 45✖️ times EBITDA, and I can assure you they buy at a considerably lower multiples…) has incited many other software companies to imitate the same strategy.


Asure Software, Asseco, Ascential, CHAPTERS Group AG, Descartes Systems Group, Software Circle plc, Lifco, Lumine Group & Topicus (2 spin-offs of Constellation) , OpenText, Tiny, Tyler Technologies, Upland Software, Vitec Software Group

But also a bunch of private (and often PE backed ) rollups like: Abingdon Software Group, Banyan Software, Dry Line Partners, Everfield, Magnolia Software, saas.group, SaaS Acquire Inc., Threecolts, Upland Software, etc…

Constellation isn’t just another player in the tech industry; it’s a visionary giant with a strategy as unique as its portfolio. Constellation’s approach of focusing on long-term growth, acquiring small and niche software companies, and maintaining a low-key marketing strategy has set it apart in a sea of aggressive tech players. With a consistent growth pattern and a geographical reach that spans continents, Constellation stands as a testament to the fact that success in tech doesn’t always have to follow the conventional path of flashy marketing and rapid scale-ups. As we look towards the future, Constellation Software Inc. is not just a company to watch but a remarkable case study in strategic growth and sustainability in the ever-evolving world of technology.

Read More

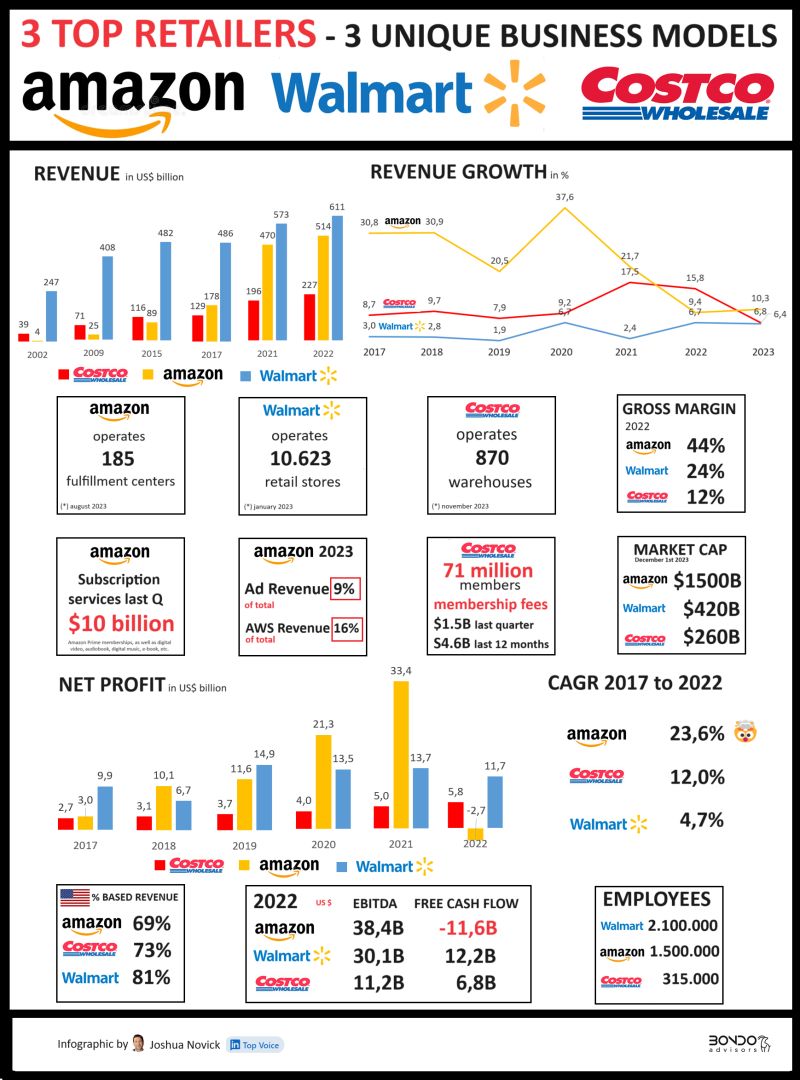
In the dynamic world of retail, three giants stand out with their distinctive business models and strategies: Amazon, Walmart, and Costco Wholesale. Each of these retail leaders has crafted a unique value proposition that caters to different segments of the market.

🚀Amazon, Walmart, and Costco Wholesale: 3 🛒leaders with 3 unique value propositions:

👜Walmart emphasizes accessibility, price and colossal selection.

🔸Among the three contenders, Walmart is undoubtedly the more traditional retail player and remains the world’s largest retailer (and 🥇company).

🔸Notably, nearly all of Walmart’s revenue comes from retail operations, while only approximately 2/3 of Amazon’s revenue is currently retail.

🔸While Amazon is expected to catch up to Walmart, this may happen a bit later than anticipated. Recent years have seen Amazon’s growth rate slow down (only a few % points above Walmart’s)

🔸Walmart primarily operates as a brick-and-mortar retailer, with a modest 13% of its revenue originating from ecommerce

🏭Costco stands out with exclusive memberships and bulk purchase savings

🔹Costco, in contrast, adopts a unique approach. It operates as a membership-based store with a warehouse style layout characterized by high ceilings, industrial shelving, pallets of products, and a broad assortment of items available in bulk.

🔹Costco typically stocks around 4,000 different products at any given time, a stark contrast to Walmart’s extensive inventory of 140,000 SKUs. Both Amazon and Walmart list approximately 500 million SKUs online.

🔹Costco focuses on bulk purchases and pledges to offer the lowest prices possible, maintaining an average margin of 11% and ensuring no product exceeds a 14% gross margin.

🔹Approximately one-sixth of Costco’s gross margin is derived from the $60 annual fees paid by its 71 million members for the privilege of
shopping at Costco. Notably, about half of Costco’s pre-tax profit is generated from membership fees

🔹Costco excels in operational efficiency, maintaining low operating expenses at just 9% of billings, compared to Walmart’s 20%.

🔹Costco achieves a remarkable per-store revenues of $280 million, far surpassing Walmart’s $60 million per store.

🚚Amazon offers convenience and a vast product selection.

💠Amazon has experienced remarkable growth, expanding from only $4 billion in revenue two decades ago to a staggering $500 billion in 2023.

💠The company is renowned for its super fast product deliveries. However, this efficiency comes at a significant cost, with fulfillment expenses accounting for over 15% of total billings, and operating expenses comprising 41% of total billings.

💠These high operating expenses have made it challenging for Amazon to generate a profit in its e-commerce/retail business.

💠Nevertheless, Amazon has diversified its revenue streams effectively. Its subscription business, including Prime, generated over $30 billion in revenue in the first 9 months of 2023, while ads brought in an additional $30 billion in the same period.

💠Additionally, (Amazon Web Services (AWS) generated nearly $59 billion in revenue and an impressive $18 billion in operating margin in the first three Qs of 2023.

The retail landscape is characterized by the diverse approaches of Amazon, Walmart, and Costco, each playing to its strengths and catering to specific consumer needs. Walmart continues to dominate as a traditional retail player, leveraging its massive selection and competitive pricing. Costco differentiates itself with a membership-based model, focusing on bulk purchases and operational efficiency. Amazon, meanwhile, is a powerhouse in e-commerce, driven by its vast product selection and rapid delivery services.

These companies’ varied strategies underscore the complexity and competitiveness of the retail sector, where each player adapts to market demands while innovating to stay ahead. As they evolve, these retail giants not only shape consumer experiences but also set the pace for the industry’s future.

Read More

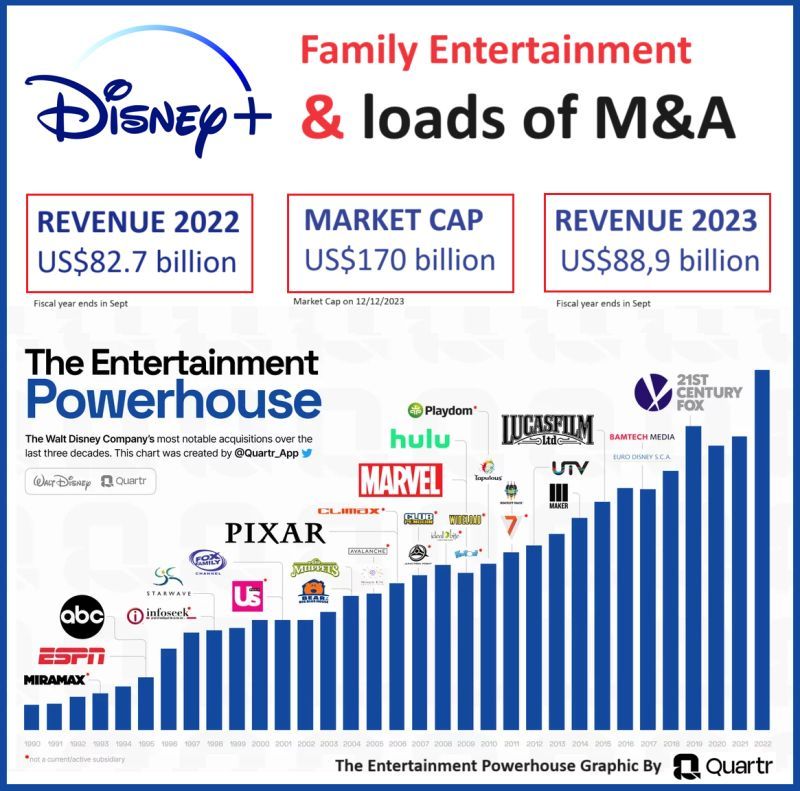
🐭The The Walt Disney Company is known by many for its original iconic creations: Mickey Mouse, Donald Duck, and Winnie the Pooh…

♠️However, it is also widely recognized for its compulsive approach to mergers and acquisitions.

👉Disney was founded in 1923 but it only executed its first major acquisition 70 years after, in 1993 with the Miramax $60 million deal.

👉In the following 30 years Disney has become one of the most aggressive aggregators of the entertainment market. Spending over $130 billion on 12 major acquisitions (besides a bunch of lesser value deals)

Here goes the list:

🔸1995: ABC and ESPN join the Disney family for $19 billion.
🔸2001: Acquisition of Fox Family for $2.9 billion.
🔸2004: The Muppets Studio becomes part of Disney for $75 million.
🔸2006: Pixar Animation Studios, known for hits like ‘Nemo’ and ‘Toy Story’, is acquired for $7.4 billion.
🔸2009: Was a pivotal year with Disney acquiring Marvel Entertainment for $4 billion, bringing superheroes like Avengers, Spiderman, and Black Panther under its wing. The same year, Disney also began its investment in Hulu, culminating in 2023 with the acquisition of the final 33% from Comcast for $8.6 billion.
🔸2010: Playdom, a game developer, was bought for $560 million.
🔸2012: Disney acquired Lucasfilm for $4 billion, adding Star Wars to its portfolio.
🔸2014: Maker Studios was acquired for $500 million.
🔸2017: Bamtech joined Disney for $2.6 billion.
🔸2019: Disney executes the highest value deal buying 21st Century Fox  for $71 billion (cash+stock)

😱The total price tag of Disney’s 30 year M&A activity is equivalent to 75% of Disney’s current market cap.

🥖Some food for thought

🌳In 1993 Disney was generating 8.5B revenue and had a 17 billion market cap

⏳In the past 30 years Disney has increased its market cap about $150 billion, but has spent 💲130 billion in M&A deals to create basically $20 billion in additional value.

🛎️The Compound Annual Growth Rate (CAGR) of revenue, during Disney’s 30 year M&A spur, was approximately 8%.

💊My thoughts:

Disney is currently competing with aggressive and cash rich newcomers in the entertainment industry, like Netflix, Amazon, and Apple, in a space where content is king. Disney’s strategy has been to go out and acquire the content leaders.

The extent to which Disney’s aggressive mergers and acquisitions strategy was purely defensive remains unclear. However, what is clear is that, at least in the short term, they have not generated the level of value one might have anticipated.

No doubt that the Marvel, LucasFilms and Pixar acquisitions were super deals. The +💲70B investment to buy 21st Century Fox is, by all means, at least questionable.

👓I adapted Quartr‘s wonderful graphic «The Entertainment Powerhouse» to include some additional data . Many thanks to Quartr (a super useful financial research APP) for the insightful Infographic

Read More